
For the fourth week in a row, a player has missed a potential match-winning shot with the last kick1 of the game. Isaac Smith relived his Qualifying Final horror last Saturday against the Cats at the MCG, but he has ample company in Todd Goldstein, Tom Hawkins, and Michael Walters who, over the last month, have all failed to give their sides the win with the most important kick of the match.
Goalkicking is without a doubt one of the most important skills in the game. Wins and losses are routinely decided on it. It seems like barely a week goes by without some ex-player coming out and lamenting the quality of “modern day” goalkicking. I disagree with these sort of takes for a number of reasons (increased intensity, improved defence, and selective memory are among the reasons why accuracy appears to have stagnated), but I’ll save that for another time.
Today, I wanted to look at the different ways we can measure goalkicking, how useful these are at measuring the “ability” of different types of players, and which players have the best goalkicking records so far this year.
First and foremost the simple goals and behinds tally. You’ve read it in the papers, you’ve seen it on Fox, in fact, you probably have a mate who knows how many goals and behinds your key forwards have kicked this year off the top of his head. But just who has kicked the most goals from their shots this year?
Simple Accuracy (Goals / Scoring Shots)
Here are all 231 players to have taken at least 10 scoring shots this year, sorted by simple accuracy. Ben McEvoy leads the way this year with a simple accuracy of 92%, scoring 11.1 from his 12 scoring shots this year.
[table “7” not found /]I stress, “scoring” shots, because unfortunately due to data availability, we don’t have much data on how many shots players have taken which have either fallen short or missed the goals entirely. If we did, I suspect a few of these records would look a fair bit worse. When some of this data does drip through to the public, it can throw up a few surprises.
Even though the data are incomplete, we can still get a pretty good idea about goalkicking ability if we look at the right things. However, looking at that table above, the limitations of a straight goals and behinds record is immediately apparent.
Firstly, we have to decide an arbitrary cut off point for when we consider the sample big enough. If instead of looking at players with at least 10 scoring shots, we look at players with at least 5 scoring shots, McEvoy is no longer number 1. Two players this year (Christian Salem and David Cunningham) have kicked 5 goals straight without registering a single behind. Of course, they are not really the best kicks in the comp, we wouldn’t expect their accuracy to remain 100% if instead of 5 shots, they had taken 50.
If we make the cutoff 20 or more shots, Christian Petracca becomes the best kick. If we make the cutoff 40 or more, Daniel Menzel becomes the best. 40 might seem like a sensible value, and Menzel really is a good kick, but if we make 40 shots the cutoff we miss a lot of forwards we would otherwise be interested in, such as Sam Reid who has kicked 22.12 or Matthew Wright who has kicked 23.7.
Another obvious shortcoming of the simple accuracy measure is that the difficulty of shots is not accounted for whatsoever. McEvoy has certainly kicked straight this year, but 11 out of his 12 shots were set shots and the majority of them around 30m out, dead in front. This is not a slight at McEvoy at all, in fact this exactly what you would want your resting ruckman to be doing, it’s just not necessarily evidence to support the claim he is the best kick in the comp.

What we need instead is a way to judge the difficulty of shots, perhaps based on how well the rest of the competition has kicked similar shots in the past. Luckily I have that exact tool, something regular readers would know as xScore. If you look at McEvoy’s shotplot closely you will see that each of those circles is a slightly different size, the bigger the circle, the easier the shot. The shots further out, and at tougher angles are smaller. As is the one right in front, 25m out. Why? Because this was the one non-set shot of his 12 scores, a snap out of the pack. This is a tougher goal to kick than the set shots right next to it.
An AFL average player given those exact shots would kick about 53 points on average (so around 8 goals). McEvoy’s 67 points (11 goals) means he’s kicked significantly above average.
Using this model, the next obvious leap is to look at which players have kicked the most points above their xScore expectation given the shots they’ve taken. These are players that have kicked straighter than the AFL average player would’ve expected to. Good kicks.
Difference Between Actual Score and xScore
Again using the 10 scoring shot cutoff, here’s how the competition has kicked.
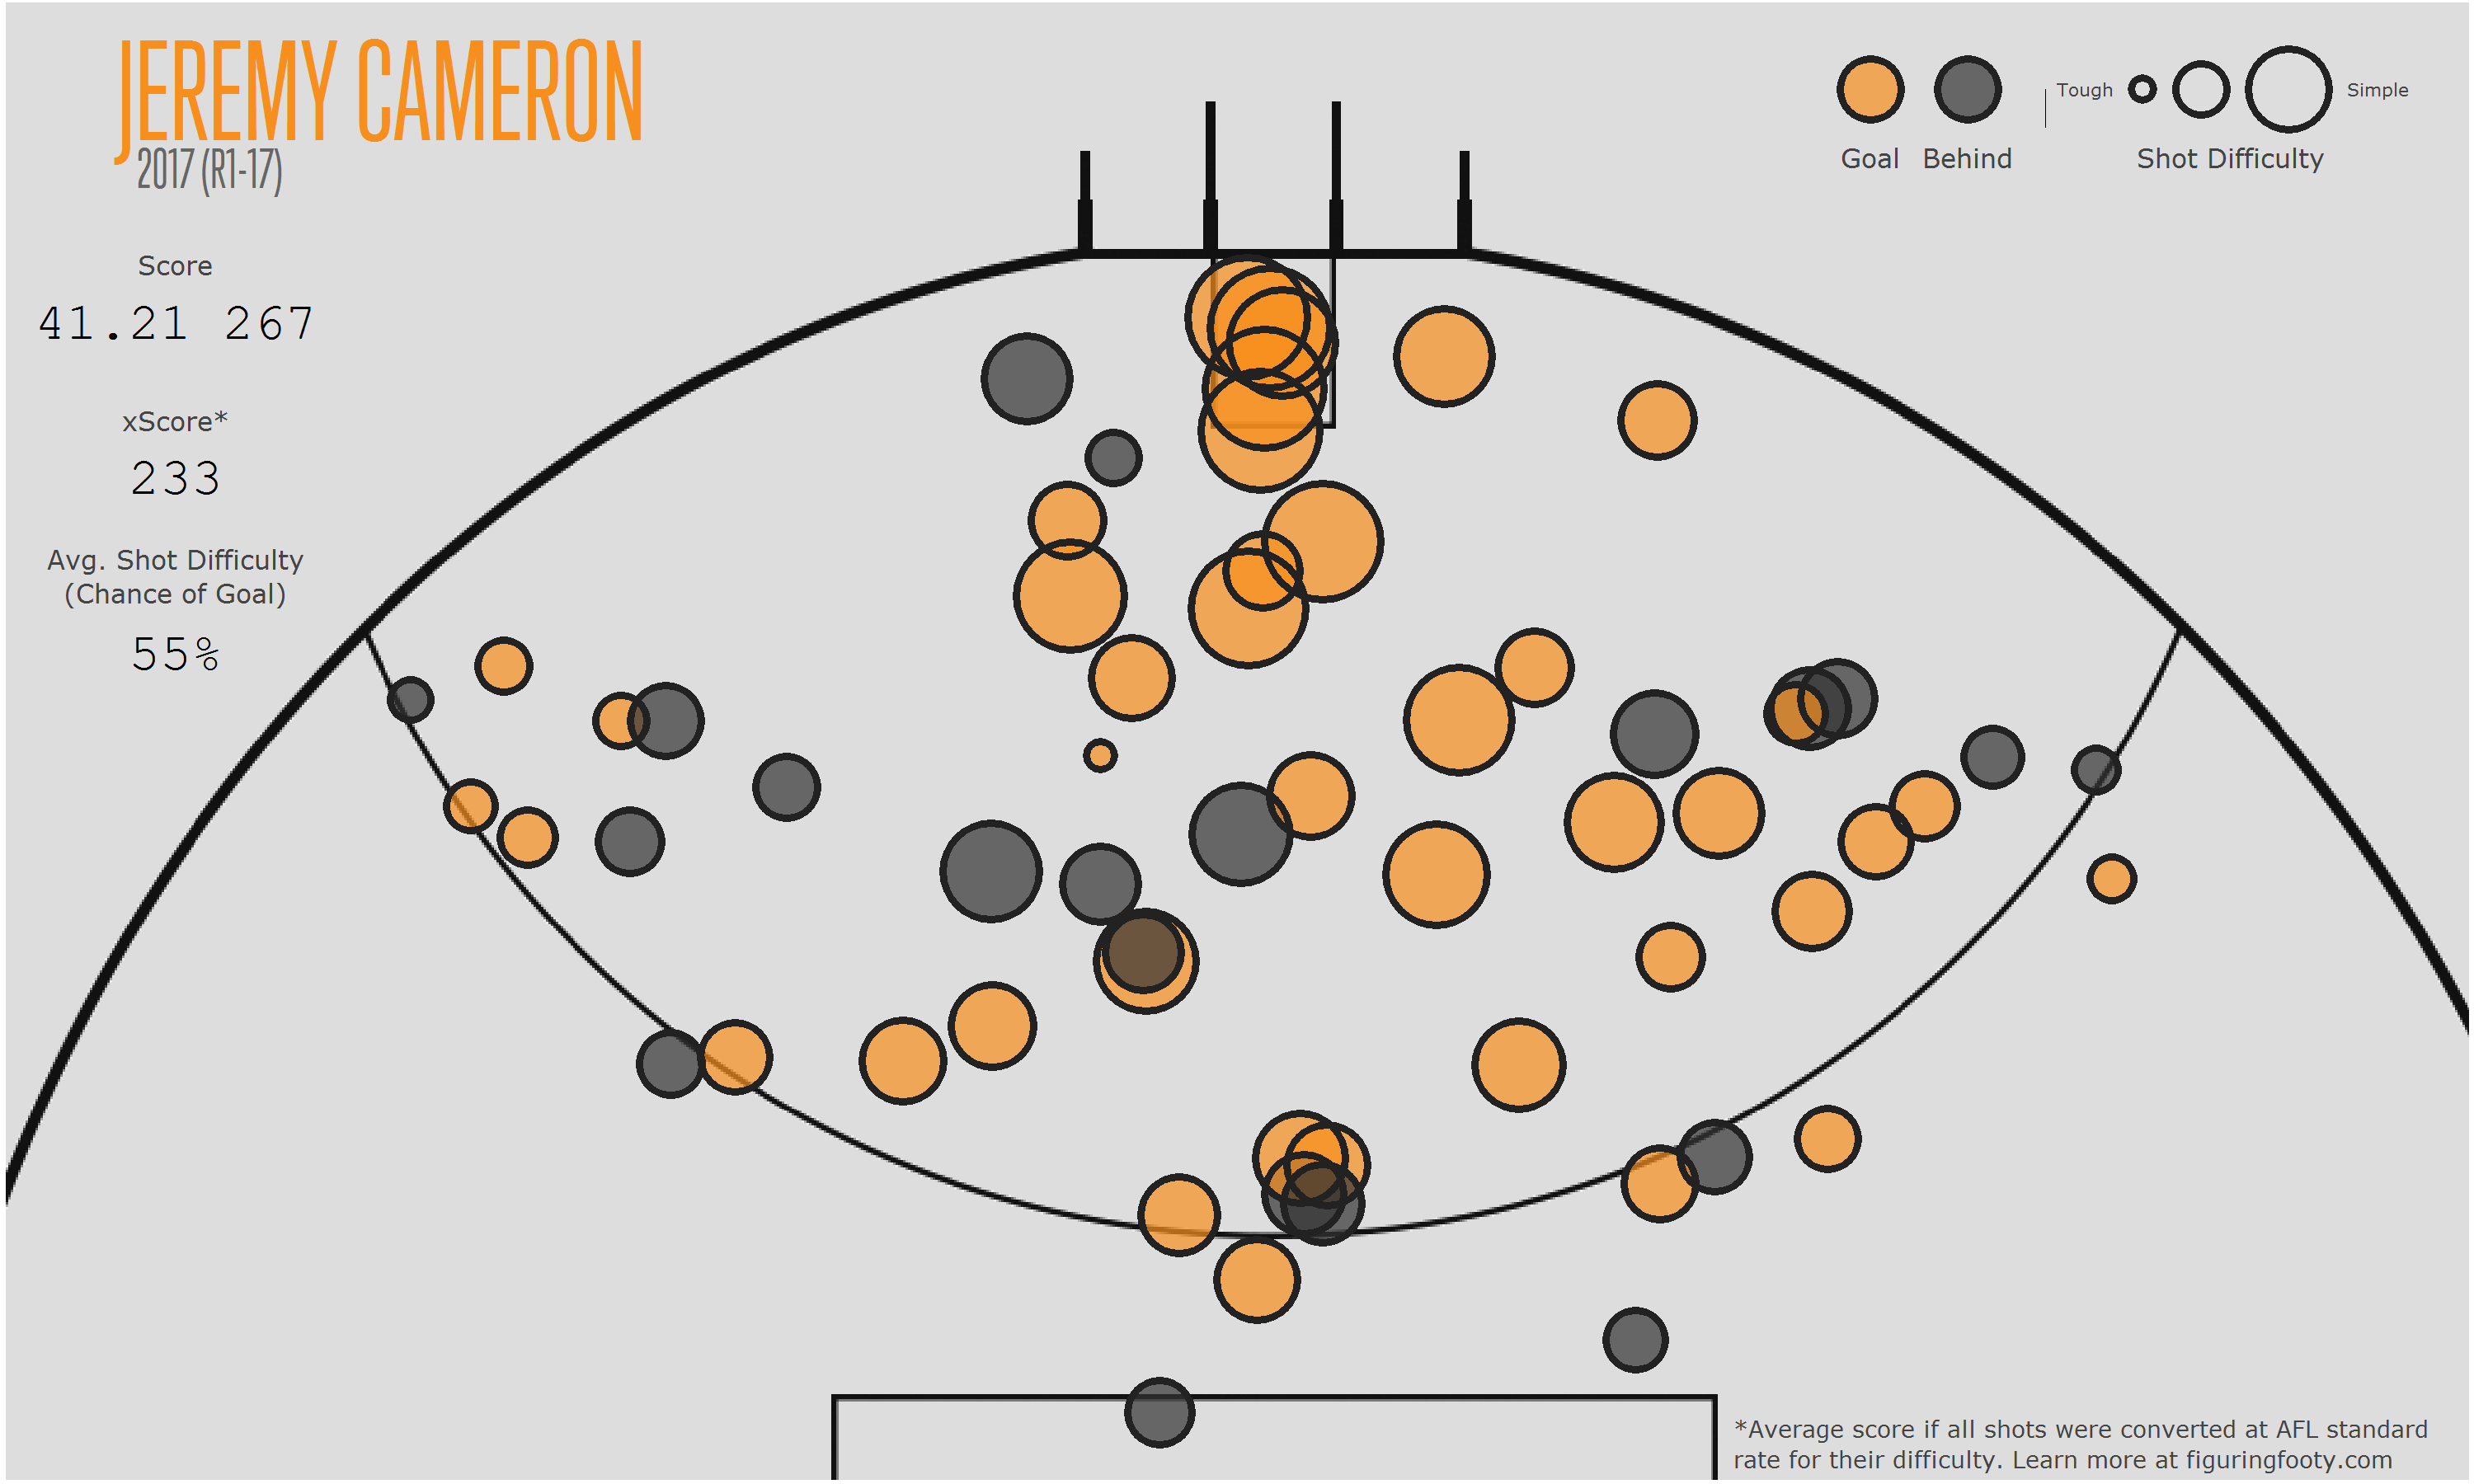
[table “8” not found /]Using this metric Jeremy Cameron becomes top of the class. 34 points above xScore means he has kicked about 7 goals more than the AFL average player would with his shots.2 This is no doubt very impressive, but it’s important to realise that the difference between score and xScore, does not solely measure accuracy, but rather naturally favours those players who take lots of shots.
Cameron has taken 62 scoring shots this season, the 6th most in the league. Kicking 34 points above xScore is not quite the same level of sharpshooting as Matthew Wright who has kicked 31 points above xScore from only 30 shots, the 53rd most shots in the league. Again, looking at their shotplots gives us a better idea of what is going on. The dark grey areas make up a bigger proportion of Cameron’s shots than Wright’s

Looking purely at score added above expectation certainly gives us an idea of the value of a player, but it’s not the best way to judge the accuracy of a player’s goalkicking. Instead we turn to the world of statistical hypothesis testing3 to help us pick out the best kicks.
Probability of Kicking As Many Goals by Luck
To explain how this works I’m going to use a simple example. Imagine a player takes 3 shots at goal, each with individual probabilities of goal4 of 0.5, 0.6, and 0.3. For those who have forgotten high school maths, probabilities are represented between 0 and 1. A probability of 0.5 is the same as a 50% chance, 0.6 is 60% etc.
The probability of a player kicking all 3 goals, assuming they are in fact AFL average, no better or worse, is 0.5 * 0.6 * 0.3 = 0.09. You could say this is the probability of an average player getting “lucky” and kicking three, as opposed actually being higher skilled then the rest of the competition. For those players with very few shots (like Salem and Cunningham) this is most likely what is going on.
The probability of the same AFL average player kicking 2 out of the 3 shots is calculated so: (0.5 * 0.6 * 0.3) + (0.5 * 0.4 * 0.3) + (0.5 * 0.6 * 0.7) = 0.36. So the probability of an AFL average player kicking 2 or more goals given these three shots is 0.36 + 0.9 = 0.45. There’s a 45% chance that a player with complete average skill would kick at least 2 goals given these three shots.
Now we expand this a bit further and look at a real example, the AFL clairvoyant, Mitch Robinson. Here are his shots this year:
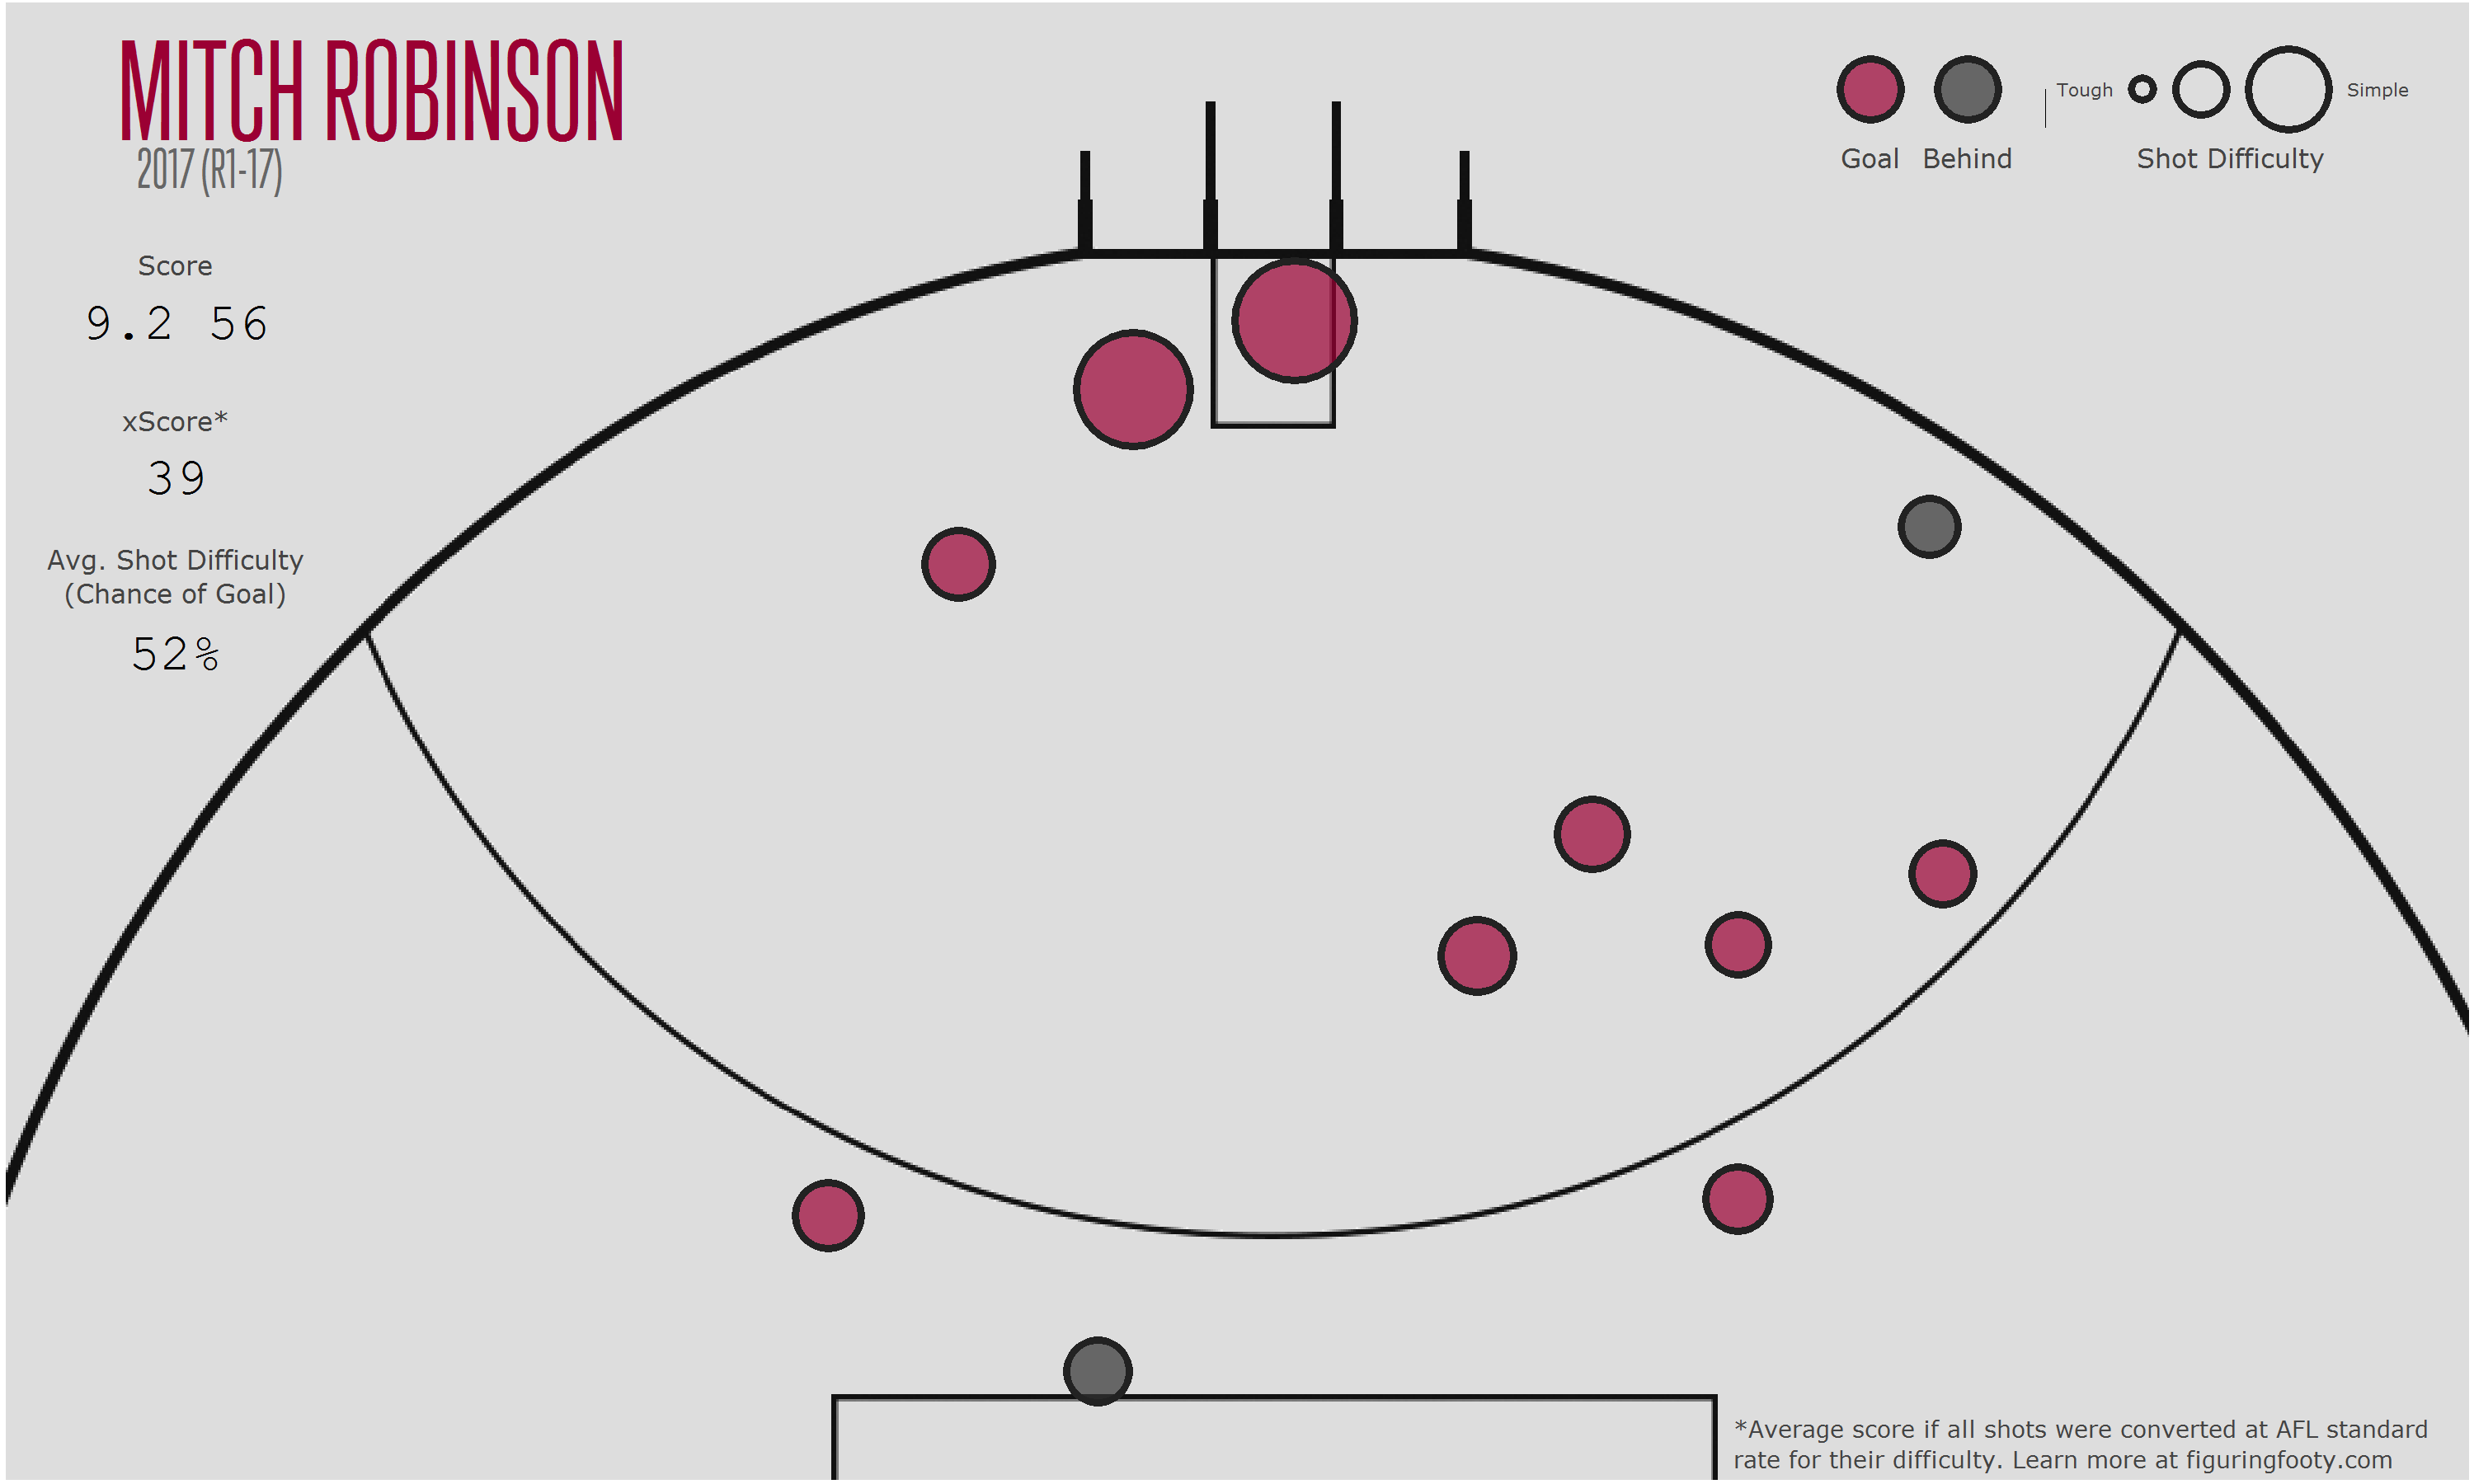
Outside of those two shots right near goal, Robinson has taken some very difficult shots this year. No other shot has had more than a 50% chance of goal if kicked at the AFL average.
Using the same method as above, we can calculate the probability of kicking 9 goals or more if Mitch was in fact an AFL average kick. This comes out at 0.0074, or a 0.74% chance. There’s less than a 1% chance that we would see this record from an AFL average goalkicker. It’s far more likely that Mitch Robinson is actually better than average.
Here’s the rest of the competition ranked by this metric:
[table “9” not found /]So there’s only a 0.41% chance (or alternatively about a 1 in 250 chance) that Matthew Wright is actually average and his record is that of an average player who got “lucky”. This may seem like a tiny chance at face value, but it’s important to remember that we are looking at 231 players here, it would certainly not be uncommon to see a few players luck out. A way to be more sure of Wright’s skill would be to look at his past season’s, but I’ll save that for another post.
At the other end of the spectrum we have the “statistically significant” worst kicks in the comp. Given the 19 shots he has taken this year, there’s a 99.94% chance that an AFL average player would kick as straight or straighter then Tom Bugg has. Maybe his suspension was a bit of a blessing for the Dees.

You can see clearly from his shotplot that other than 4-5 sitters, he’s missed virtually everything else he has attempted.
Mav Weller from St Kilda is a similar story. 99.5% of kickers would do as well or better with his chances this year.

Have a click around and find the best and worst from your club.
Looking solely at set shot kicking could also be enlightening. xScore can sometimes misrate the difficulty of shots from open play, as pressure on the kicker is not known exactly, but rather inferred from other data. If we looked only at set shots we could remove some of this noise and get a better idea of who is actually the sweetest kick in the comp. The problem with this is the sample sizes become a lot smaller. I may have a look at this later on in the year, but as it stands now, Jonathon Patton is by far and away the best set shot.5