Skip to content

Author: user

2016 Round 2 – Tips and Predictions Home teams travel away

Posted in Ratings, Tipping, and Uncategorized

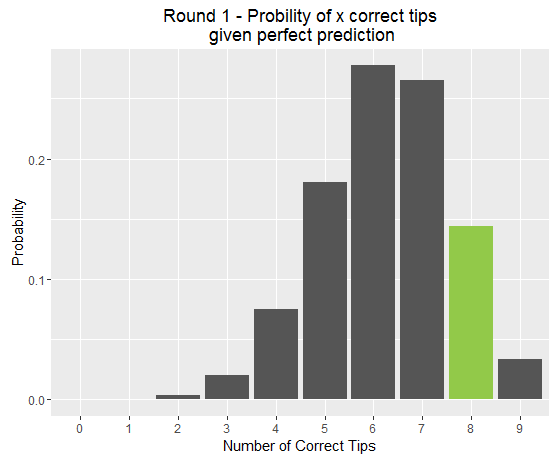
Week 1 proved to be a very successful round of tipping for the FFSS (Figuring Footy Scoring Shots) predictor. 8 out of 9 games were tipped correctly, and if you followed through on my recommended bets you would have netted yourself a tidy little profit of +13.02 Units (which would be about $130 if you started with a total bankroll of $1000). However, I also wrote this week about grounding our expectations in reality, and why last week’s results may have been a bit lucky.

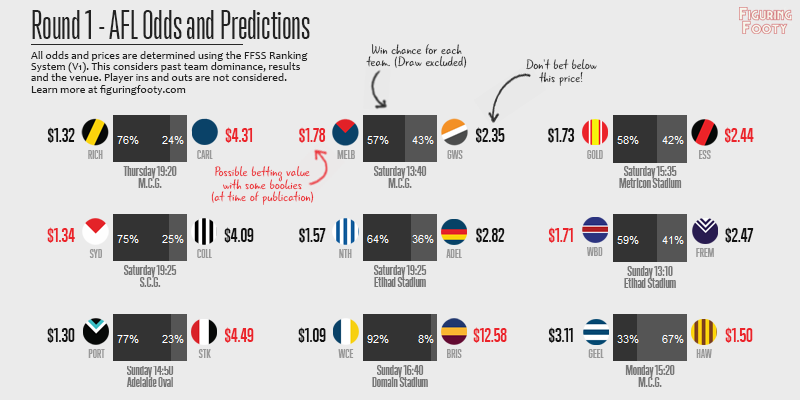
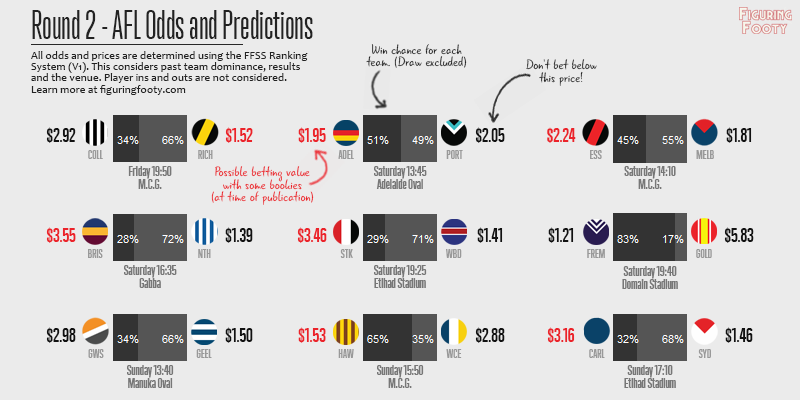
This week poses us a fresh new challenge. As has been discussed a fair bit on Twitter, last round saw every home team get up. With the way the AFL draw is organised in the early rounds, this means that every single one of Round 1’s winners, goes into Round 2 as the away team. This means that each of them will face a handicapping by FFSS’s Home Ground Advantage calculator. HGA takes into account distance travelled by each team, ground experience by each team and the AFL designated home team (for games that are played at shared stadiums). This week, HGA varies between ~7 ratings points for Essendon at the G against Melbourne and ~110 ratings points for Freo at home to the Suns.1

Tipping Results vs Expected Round Probabilities Why getting a perfect round of tipping is such a big ask, even for a computer.

Posted in Ratings, and Tipping

My new computer predictor algorithm FFSS (Figuring Footy Scoring Shots) fared pretty admirably in her first week of tipping, nailing 8 out of 9 possible results. Only a bit of Dangerfield-inspired magic late on Monday afternoon prevented a perfect start to the season.

Anybody who has read this blog before will know that before the upcoming round I publish expected win probabilities for each match to be played. These probabilities are calculated by looking at the FFSS ratings of both teams and accounting for the venue. For example, I gave Sydney a 75% chance of beating Collingwood at home. They of course went on to thump them by 80 points. So then, if Sydney were so good, why didn’t the model rate them even higher and know ahead of time that they would dispatch Collingwood with ease?

2016 Round 1: Tips and Predictions Who's rated what?

Posted in Ratings, and Tipping

After almost 6 months of mindnumbingly football-free weekends, the 2016 season is set to get started this Thursday night at the MCG. Having recently unveiled my new team ranking model, FFSS, I now have a system by which to predict probabilities for upcoming matches.

I have translated my calculated probabilities into inferred match odds and compared these to the current prices offered by some of the bigger bookmakers around the country, highlighting any major discrepancies. The reason I have done this is not to recommend or even advocate having a bet on any particular team (although I will certainly talk about “good bets” and “value”). But it is rather used as a way to explore the strengths and weaknesses of the model in greater detail.

Bookie prices can be seen as a general “public consensus” about what the true probabilities of a team winning a match are. When the model differs greatly from the public view it is good to know why. Is it seeing something else that the public are not valuing? Or, as you’ll see this week, is it missing entirely something that others are taking into account? If it’s the latter, then there is clear improvement that can be made, if the former, then I guess we’re on to a winner.

NOTE: All betting amounts will be discussed as unit bets assuming you have 100 units to play with as your full bankroll. For example if you have $10000 that you’re willing to lose over the year if worst comes to worst, then 1 unit is $100. A higher unit bet shows more confidence in the models assessment and the value to be made. If you are interested in betting as a serious money building exercise, first I would question whether you really want to cope with the stress of the virtually guaranteed big losses you will experience week to week. If the answer to that is yes, then read as much as you can on Bankroll Management and the fractional Kelly Criterion. You are very likely betting too much to be sustainable.

Figuring Footy’s New 2016 Predictor – FFSS Ranking System Meet the Figuring Footy Scoring Shot Team Ranking System

Posted in Uncategorized

Late last year I introduced SimpElo, a (very) simple Elo-based ranking system for the AFL. During the summer I have been working hard to improve…

2015 Tipping Performances of Fans, Experts and Analysts Do footy pundits tip matches better than regular fans?

Posted in Tipping

Around this time of the year, offices around Australia get swept into fierce competition by the vicarious challenge that is footy tipping. While Janice from…

The SimpElo Team Ratings A simple Elo model for rating teams in the AFL

Posted in Ratings

Developing an accurate and realistic rating system is often a primary for a sports analyst. Just about every organised sport competition in the world has it’s own implicit rating system in which we expect “good” teams to be rated higher than poorer teams. In AFL footy we call this the ladder. The problem with using a team’s position on the ladder to infer how well it plays is that the ladder is sorted primarily by wins. While winning lots of games is important (#analysis), how many games a team has won previously is not always the best indicator of how many they’ll win in the future. This is especially true of a competition like the AFL which uses an uneven draw. A team towards the top of the ladder that has yet to face any other difficult teams has obviously not proven itself to be a strong side.

A “true” rating system provides us with a wonderful descriptive and predictive tool. We can compare teams over time. (Just how does this year’s Hawthorn team hold up against Brisbane of the early 2000s?). We can map changes in team rating after notable player and administrative changes. (How important will Patrick Dangerfield’s move from Adelaide to Geelong be for both sides?). And perhaps most tantalising for some, we can calculate implied probabilities for upcoming matches and even seasons and make a profit betting against inefficiencies in sports-betting odds. (What is fair price for Hawthorn to make it 4 in a row next season?)

Given this motivation, I have created a few different types of rating systems that I have been testing out over the last season. Today I’ll introduce you to simplest of these, a basic Elo model which I have donned “SimpElo”1, and show you the impressive results that can be achieved with just a few basic principles.

A Brief Analysis of Scoring Shots in the Grand Final

Posted in Game Analysis, and Scoring Map

I have been playing around with different types of data visualisation lately, particularly visualising scoring shots. I’m hoping to clearly see the quality of chances each team created to get a better idea of the styles they are playing and also their finishing ability. I previously looked at Goal-Kicking Accuracy in a very general sense and found that every team converts at more-or-less the same percentage (Goals/Behinds) in the long run. However, in that post I didn’t consider the quality of chances created, which is something I plan to spend much more time on in the future.

How the Best Teams are Not Necessarily the Ones Who Kick the Most Goals Looking at the importance and repeatability of shot creation

Posted in Team Metrics

Last article, I looked at how important Goal-Kicking Accuracy was to the chances of winning a match of AFL footy. It turned out that it was very important, teams that kick straighter very often end up winning. Unfortunately, in investigating this I also found out that repeating a straight kicking performance week-to-week with any sort of consistency doesn’t really happen. Goal-Kicking Accuracy is pretty much a crapshoot. Sometimes you’re on, sometimes you’re off, with no real rhyme or reason.

This naturally leads us to our next question. If kicking straight is not repeatable, what skills are? Why do some teams win much more often than others? What areas of the game do they excel in that are repeatable week after week?

Seeing as kicking more goals than your opponent is really the name of the game, and we now know accuracy is so variable, let’s start in the simplest place possible by looking at the number of scoring chances a side creates. While we’re at it, let’s also see how well they limit their opponent’s scoring chances. Is this where true, repeatable team talent lies?

Are Good Teams Straighter-Shooters? Exploring the importance and consistency of Goal-Kicking Accuracy.

Posted in Team Metrics

Goal-Kicking has long been touted as the single most important skill in Aussie Rules footy. Obviously, if you can’t kick a goal, you’re never going to win a game. This is why it is surprising that while goal-kicking accuracy has improved over the last 40 years, it has in no way matched the corresponding improvements in other important match skills as footy has become the professional, scientific game it is today.

While this is true (and certainly something for kicking coaches to think about), I’m less interested in the long-term historical shift in Goal-Kicking Accuracy (GKA) and much more interested in what we can learn about a modern day team in the AFL from how they kick in front of the sticks. Do better teams have a consistently higher GKA? Can we use the past GKA of teams to tip upcoming matches? Can it help us predict a premier?