
This season, The Arc is running a simple little competition asking footy fans and modelers alike to predict and assign a probability to each team making the finals. These predictions will then be assessed at the end of the season using Brier scoring, and the most accurate predictor will be bathed in the admiration and envy of all others. You know, standard footy tipping stuff.
This of course piqued my interest, I love footy tipping. The problem is, I don’t really have a model designed to make these sort of projections. I could theoretically simulate the season a bunch of times using the model I use for individual match predictions, FFSS (Figuring Footy Scoring Shots), but this model, by design, is pretty dumb early on in the season. Before the first round, FFSS simply looks at each team’s rating at the end of last year, assumes they will become “more average” and takes it from there. Once we get a few results in, that’s when FFSS begins to shine. A high “k-factor” in the first few weeks means the models learns very quickly who has improved and who has fallen. Using FFSS without the benefit of a few weeks of results seems silly. I’m pretty sure GWS haven’t got “more average” during the off season. Perhaps they’ll have an off year, but their scary age profile means they’re more likely to improve than drop. And another two top 5ers probably doesn’t hurt things.
Ideally, the way I’d like to solve this problem would be by writing a new model designed to do just what the competition calls for, predict team quality ahead of a new season and from this project the likelihood of each side making the 8. This would probably involve looking at age profiles along with transfers, retirements, injuries, etc. However, I’ve just got back from a long holiday, the submission deadline is on Sunday and I can’t really be arsed doing all that right now, so instead I’m going to rely on my gut. Well, my gut with a bit of help from the computer.
A Season is Just 198 Individual Matches
The problem with FFSS is that the initial ratings are rubbish. The framework of the model however can still be used to make individual match predictions after substituting in our own, more reasonable ratings. More on how to get those ratings later, but first I’ll run through how FFSS does it’s magic as a little primer for those unfamiliar with Elo ratings.
To get the estimated probability of the home team winning any match we need three inputs; a home team rating (HTRat), and opposition rating (OppRat) and a value for home ground advantage (HGA).
$$!Probability\ of\ Win = 1/10^{\frac{OppRat-HTRat-HGA}{400}+1}$$
HGA is calculated as so
$$!HGA= 11.4 \times LogDiffDist + 19.4 \times \frac{HTGroundExp}{HTGroundExp-OppGroundExp}$$
Where,
$$!LogDiffDist= ln(Dist\ Travelled\ by\ Opp) – ln(Dist\ Travelled\ by\ HT)$$
Home team and opposition ground experience is simply the number of games each side has played at that particular ground over the previous season and the current season up to and including that particular match. There are other ways to calculate home ground advantage, but this combination seems to work well for me.
In general interstate HGA equates to between 80 and 110 ratings points. HGA between teams from the same state is usually between 0 and 20.
To get a sense of the way the equation is set up, a 70pt difference (including HGA) between sides means the higher rated team is expected to win about 3 out of every 5 games (60%) if the two sides were to play many times. A 240pt difference means the better team is tipped to win 4 of 5 (80%), and a 380pt difference favours the top team 9 times out of 10 (90%).
Trusting the Gut for Ratings
We could easily just estimate a single rating for each team in the competition, run a few season simulations, note down the results and leave it at that. But while we may have a general sense of which teams are more likely to be good and which teams are likely to struggle, we don’t know exactly how good each team will be this year. Instead of a single point estimate, I’ve mucked around with some lognormal1 distributions, matching them to my general gut feel on the likelihood of how well each team’s season will turn out.

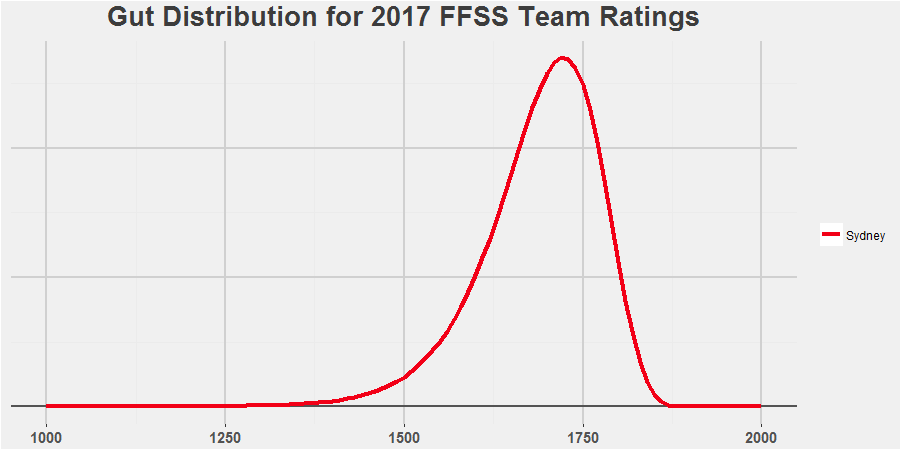
For those not familiar with probability distributions, don’t worry, the intuition behind this is very easy. Imagine picking a point anywhere under the red line at complete random. Drop vertically down from there and whatever number you hit on the black line is your ratings point estimate. So if you pick a point at random for Sydney, it’s more likely to be between 1700-1750 than it is to be between 1500-15502. There’s just more space under the line there. This matches how I see Sydney, a very good team, likely one of the best in the comp, but it’s not out of the realms of possibility that they pick up a few injuries to key players, their young guns stagnate a bit and they slip back to pack. Not out of the realms of possibility, but certainly not likely.
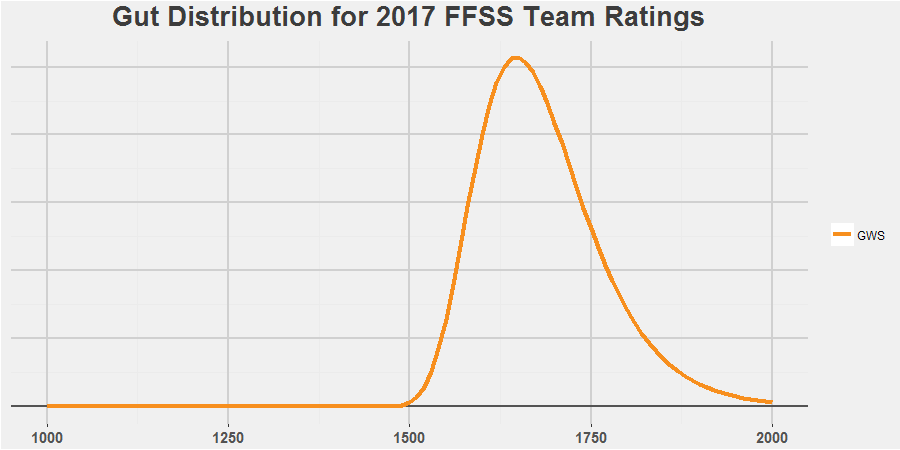
FFSS and I still have GWS being just a touch behind Sydney. The difference between the two in my opinion is that the Giants have nothing but upside. With their depth, I just can’t see them picking up enough injuries to drop below average, while I think there’s a distinct possibility that they kick off and become essentially unbeatable.
You can have a look at all my gut feel distributions in the interactive plot above and then let me know on twitter what an idiot I am for under(over)rating your team’s chances this year.
Simulating 2017
Simulating the season is as easy as using our distributions to pick a rating for each side, calculating the probabilities for each match using these ratings and then running a random number generator to pick winners and losers from each of the matches relative to predicted chances. We then count up all the results and check who has enough wins to make the top 8.3 Run this simulation 10,000 times and we have an estimate for the probability of each team making the finals.
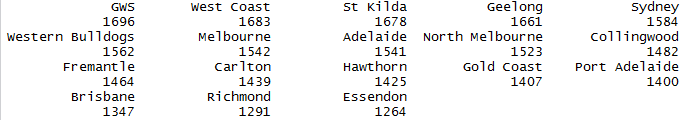
For example, our first simulation spat out these team ratings.
Resulting in a final ladder that looked like this.
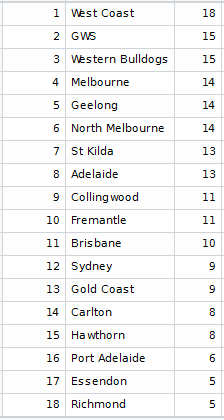
Obviously a bad year for Sydney and Hawthorn, but looking at Fremantle last year, it would be silly to think that a top team falling apart couldn’t happen.
Results and Feelings
After all 10,000 sims, these are the probabilities of each team making the 8 and these are my entries for The Arc’s competition.

How confident am I that this method will work? Not really at all. It’s entirely dependent on my gut feelings being correct, and I’m not sure really how much trust I have in that. That being said, it seems to broadly match the odds being given by the bookies at this stage, so that’s something to feel slightly more confident about.
We also only get to play the real season once rather than the 10,000 times the statisticians would prefer. So even if my feels are somehow completely correct, the real season may be one of those bizarre sims where Carlton win the comp and the Dogs snag the spoon. But that’s just footy.