
Over the last few years some new stats terms have crept into the footy fan’s lexicon. It’s unlikely at the start of the decade you would have given much thought to how many “rebound 50s” a defender has, or who in the competition has the most “metres gained”. The usefulness of these new numbers vary, but one stat I do think has the potential to change the way we think about footy, due in part to its usefulness but also its simplicity, is the number of Score Involvements each player has.
I’ve written about Score Involvements a couple of times before. Basically, a player earns a Score Involvement any time they are directly involved in a play which leads to a score for their team. This could be anything from a handball in the back 50 which is eventually worked up the other end for a behind or actually kicking a goal yourself.
Players in high scoring teams naturally rack up more Score Involvements than players in struggling sides. It’s perhaps unsurprising that 3 of the top-6 players in the comp this year were Crows players. If your team is the highest scoring side in the comp, you may only need to make a few routine passes each week to finish with a healthy ScoInv total.
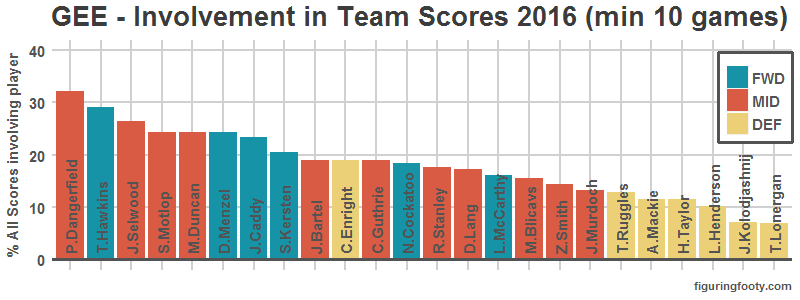
That’s why, instead of looking at raw Score Involvement figures, it turns out to be a little more interesting to look at the percentage of a team’s total scores each player was involved in. For example, in the 24 games Patrick Dangerfield played last year, he was, on average, involved in 32% of all Geelong scores. Roughly 1 out of every 3 Cats scores had Danger’s hand in it somewhere. The next most involved Cat was Tom Hawkins who was in an average of around 29% of all scoring plays in the 23 games he played.
When we compare different teams in the comp we begin to see a few unique scoring “styles” emerge. Some teams rely on players in certain positions much more than others1. Some have a “key” player involved in many of their scores whereas others have more balanced and even avenues to goal. There’s a lot more we can go into with this, but as a starting point I’ve identified 4 basic styles of scoring that seem to describe how most of the teams go about it.
1. A Dominant Key Forward
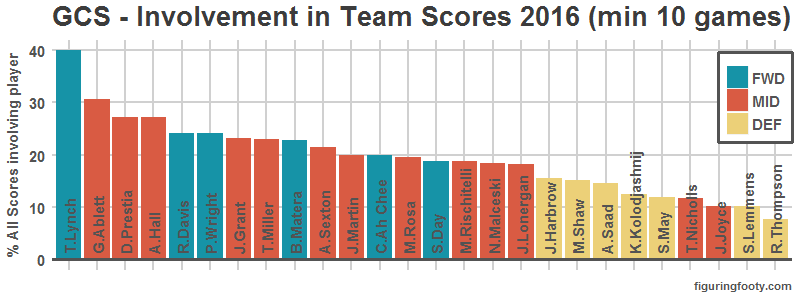
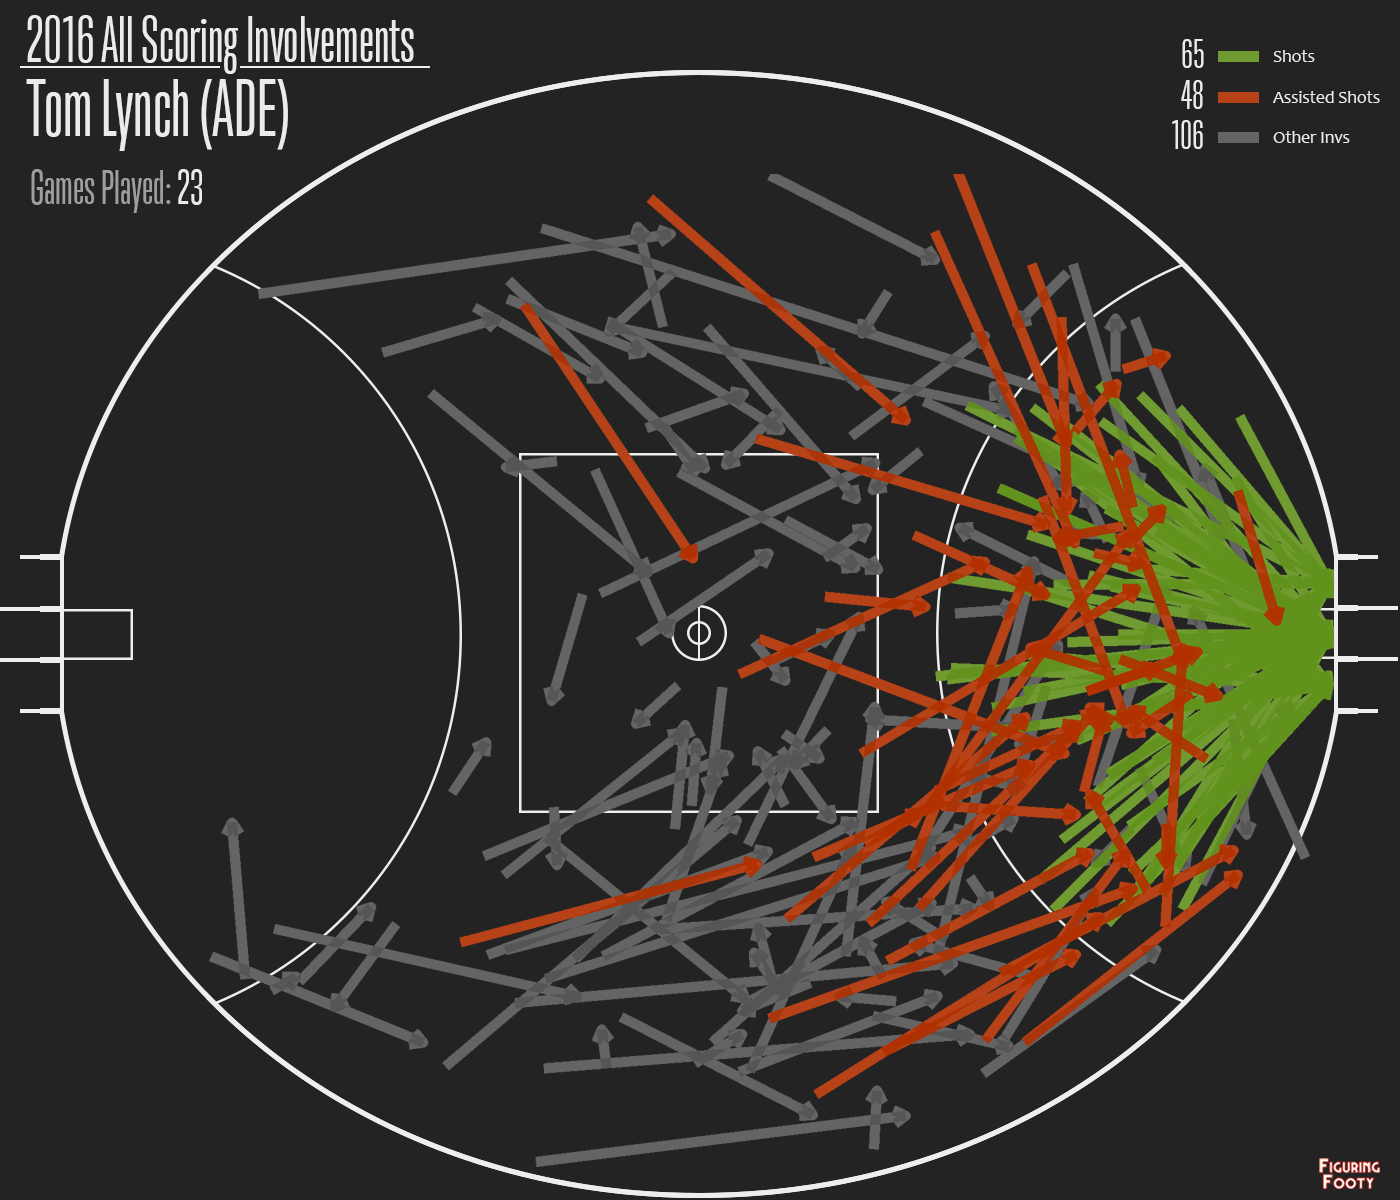
The single player with the biggest proportion of their team’s Score Involvements in the AFL is Gold Coast’s Tom Lynch. Lynch was involved in around 40% of all Suns scores this year, almost twice the involvement of the next best forward. Here’s a breakdown of all those involvements:

As you can see, the bulk of these Score Involvements come as shots. He is the “complete package” stay at home key forward, working well anywhere in the 50 and making chances out of most of what comes his way. Lynch is the Suns’ most popular route to goal by a fair margin.
Other clubs using this style: Sydney, Richmond
2. A Multifaceted Forward Line

Adelaide’s top Score Involvement player is also a forward named Tom Lynch. But in stark contrast to the Suns man who was involved in 40% of Gold Coast scores, Crow Tom Lynch had a hand in only 30% of the Crows’. However, as Adelaide were such a high scoring team and played finals, he still managed to rack up a few more Involvements in real terms. Here’s how he got them:
Whilst still getting in the scoring himself, Lynch’s true value lies in his ability to get up the ground and sweep the ball down the wings. Pair this with the unique talents of Betts and Jenkins as well as Tex Walker roaming up he centre and slingshotting the ball with a 60m+ boot and you can see that there are many strings to the Adelaide bow. Their advantage lies in their variety of talented forwards.
Other clubs using this style: Hawthorn, West Coast, Melbourne, St Kilda, Fremantle, North Melbourne
3. One (or two) Lone Midfield Monster(s)
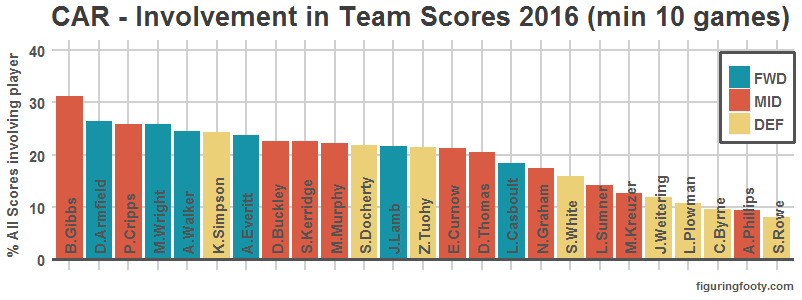
As we saw earlier, Dangerfield (along with a bit of help from Selwood) are the dominant midfielders behind the bulk of Geelong’s scoring. Bryce Gibbs (along with Patrick Cripps) play the same role at Carlton; chipping in with the odd goal, but setting up many more.
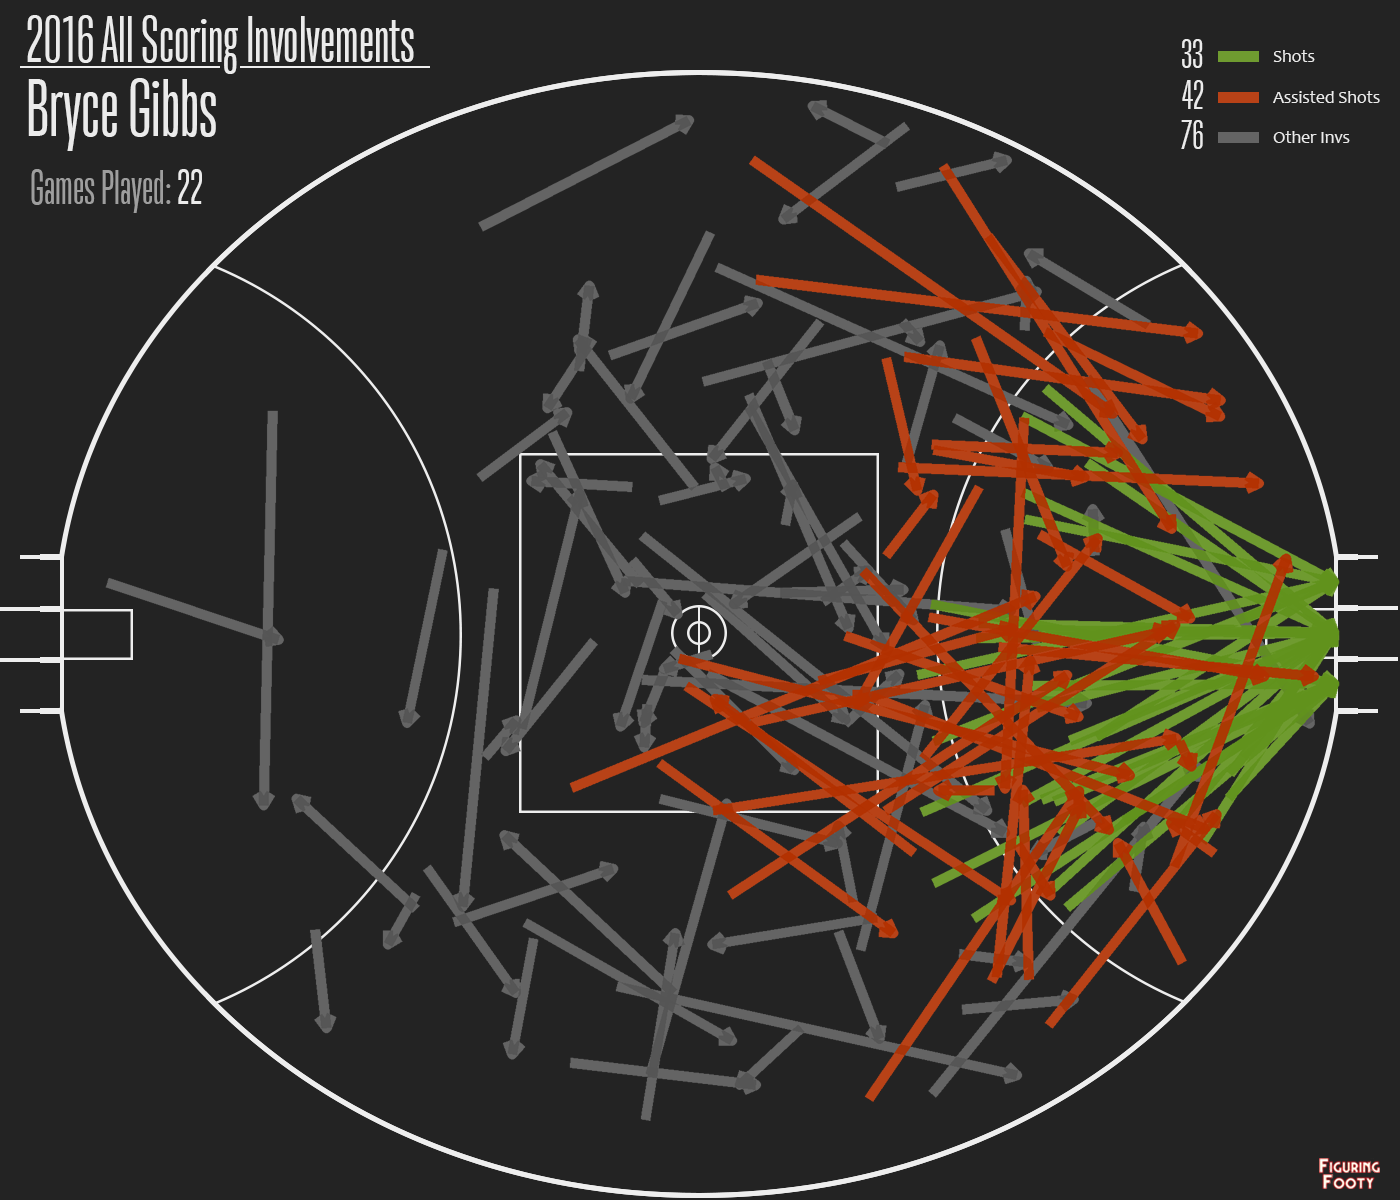
Involved in around 5% more scores a game than his next best teammate, it’s unsurprising the Carlton were very reluctant to give up Gibbs this trade period. Those long orange lines show how many shots he sets up directly off his own boot while the grey involvements show a player working all around the ground.
Other clubs using this style: Geelong, Port Adelaide, Collingwood, Brisbane
4. A Well-Oiled Midfield Machine
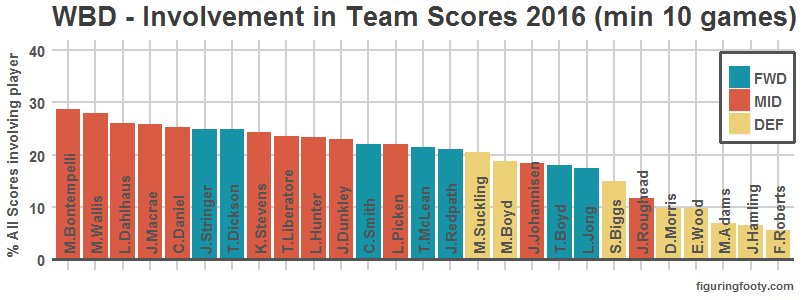
One of the surprising things about this year’s premiers, was the lack of a genuine star, standout player. Sure, Bontempelli has the potential to be that and Tom Boyd may yet live up to his hype (and pricetag), but you couldn’t point to one player and say that they would be lost without them in 2016. In a year ravaged by injuries, this was a critical element to their success. Their best midfielder, Bont himself, was only involved in around 5% more scoring plays each game played than their tenth best midfielder, Liam Picken.

Quick hands through the middle and a dangerous boot up front make Bontempelli the Bulldog’s most important important scoring player, but he has a lot of friends in that regard.
Other clubs using this style: No other club has quite the same setup as the Dogs. Sydney and GWS have similarly even, skilled midfields but both have a more influential forward dominating their Score Involvements.
Which Style is Best?
I’m not sure this question has a definitive answer. There were genuinely good teams playing each of the four styles last year.
I would say that the styles relying on one or two individual stars are highest risk as they are clearly the most susceptible to injury. However, that’s not to say these teams shouldn’t be utilising their star players to the best of their ability. It’s also not to say that they wouldn’t be able to switch into another style if such an injury did hit.
If Sydney lost Buddy they still may be able to find success by spreading the load around in a different way. But while he is fit, it only makes sense to take advantage of his freakish ability by getting the ball to him as much as possible.
We also need to consider the flipside to your own scoring. That is, how well you limit your opponent scoring. Adelaide have a well rounded forward line, but this means resources (cap space etc.) are moved away from their midfield and defense. Perhaps for this reason an army of talented midfielders is the right way to go. It certainly worked for the Dogs.
Just to be clear, this metric treats goals and behinds as equivalent, correct?
Yep, you’ve got it. In the future I may look at who is involved in creating the highest quality shots.