
In the lead-up to Saturday’s Grand Final I’ll be posting a new article each day previewing the big match. These articles will use some of the graphics and tools I’ve introduced over the last month to compare the Swans and Dogs seasons to date and make some observations about where the game may be won and lost.
On Tuesday, I had a look at the unique way each team defends. Wednesday, I retraced each club’s season and saw the matches and players that got them to the big dance. Yesterday, I looked at how both sides can kick a winning score.
I’ve had some great feedback from this series of articles and I’d like to thank the thousands of you who have read, shared and engaged with my writing this week, and also those of you who have followed my sometimes tedious ramblings on Twitter or on the blog throughout the season. It doesn’t get said enough, but the only “pay” that any of the amateur footy writers you may have read get is a nice comment or two from a reader. This really can go a long way.
Today, as a final preview before the highly hyped game tomorrow, I thought it would be good to answer some questions I’ve got over the last few days.
Past Games
https://twitter.com/Mezzoculo/status/780642480647614464
The “narrative” here is that Sydney are happy to sit deep and play more of the game in their defensive 50, while the Dogs attack the ball in the midfield and try to prevent it from getting too close to their goal.
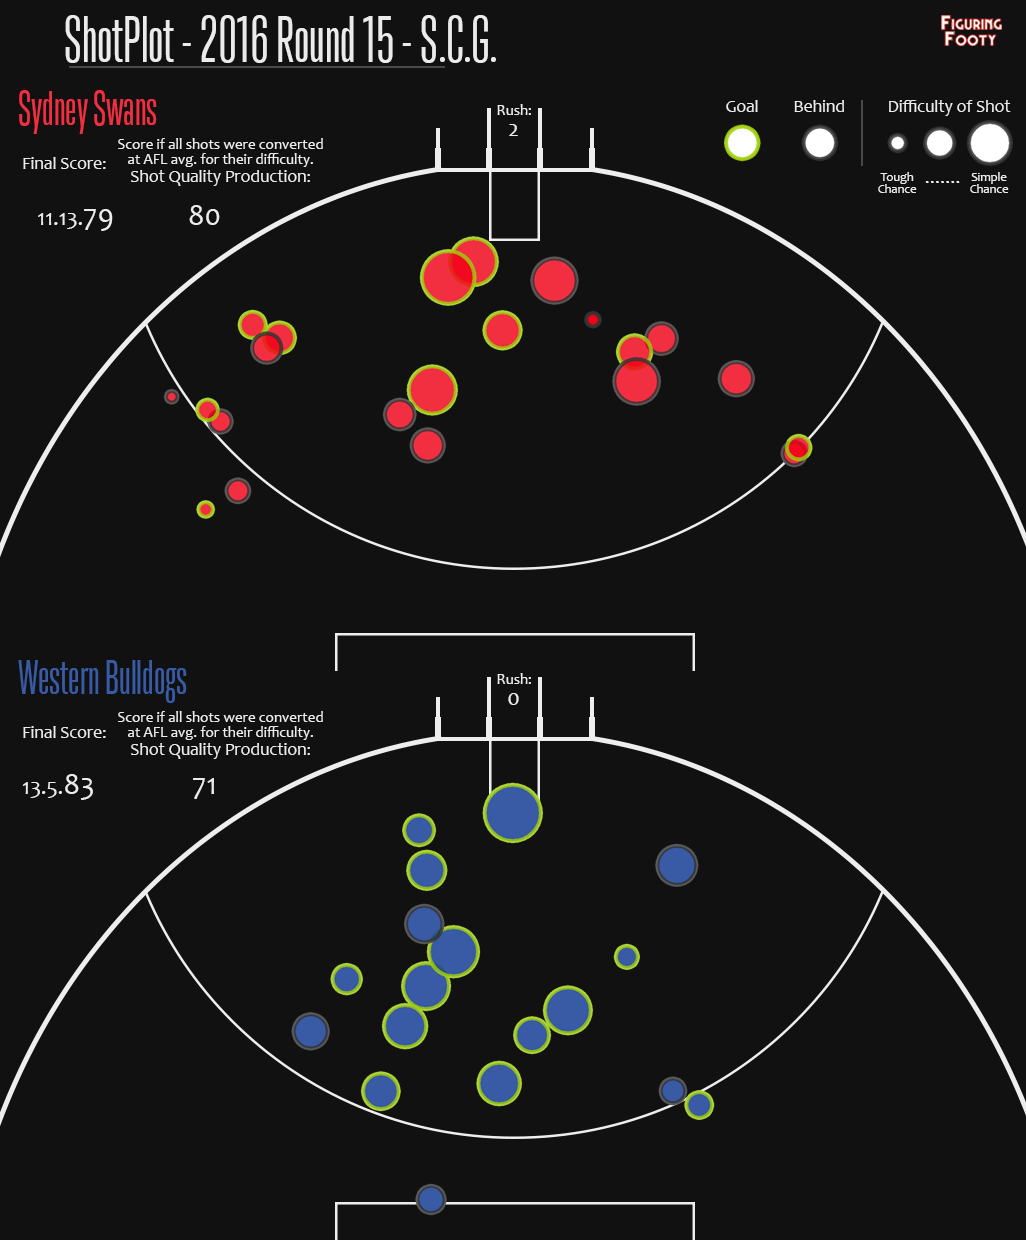
In Round 15 this year, the Dogs beat the Swans 83-79 on the SCG. In that game Sydney had 25 shots from 53 Inside 50s, while the Dogs only managed 20 from 56 I50s. On the face of it, that looks like it pretty much matches what I was saying. Here’s how the heatmaps looked:
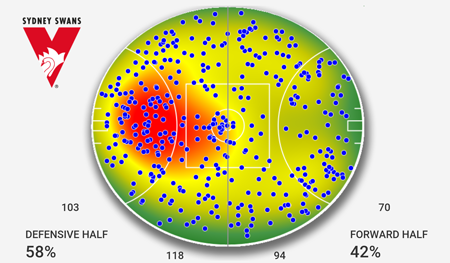
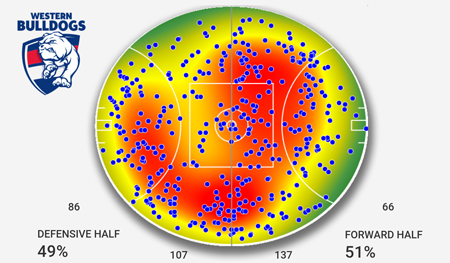
Broadly speaking, the story checks out. Despite having slightly fewer possessions in total, the Swans had way more ball in their defensive half. The Dogs concentrated their possession more in the midfield.
It should be noted, that despite kicking a higher score, the Western Bulldogs actually created fewer quality chances. If converted at the AFL average, each side’s chances would have seen the Swans get up 80-71. The Dogs’ straight kicking won them the game. While it’s fair to say that “good kicking is good football”, they wouldn’t want to rely on this happening again tomorrow.
I won’t look back at the 2015 round 5 clash. In my opinion this was too long ago to mean much. The teams have changed.
Blue Dots
https://twitter.com/portusprince/status/780762071029784576
Those heatmaps are ripped directly from the AFL app. It doesn’t really say what the blue dots mean, but I’d say probably possessions?
Player Ratings
I agree with both of these. The Player Ratings system isn’t perfect and it’s easy to pick holes in it with individual examples. I’ve done it myself with Bontempelli.
But it’s almost certainly the best automated player ratings system we have right now. It’s easy to trash it, much harder to come up with another system to replace it outside of a “this is what I think” type thing. For anybody interested in reading a bit more about it, this document is a good start.
It should also be noted that I’m using a weighted moving average of each player’s last 40 games. This measures Heeney’s whole career but only Stringer’s 3rd and 4th season. Heeney’s early “finding his feet” games are still part of his rating.
Set Shot v Open Play Shot Locations
Came out really well. Best of the series this week so far.
Have you thought about set shot locations v non-set shot?
— Cody Atkinson (@CapitalCityCody) September 29, 2016
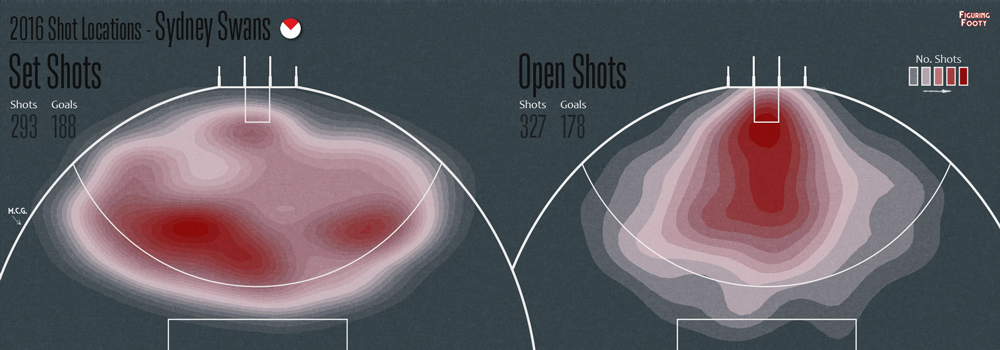
I’ve had a bit of interest in the attacking versions of the shot heatmaps so hopefully these answer any queries you’ve had:

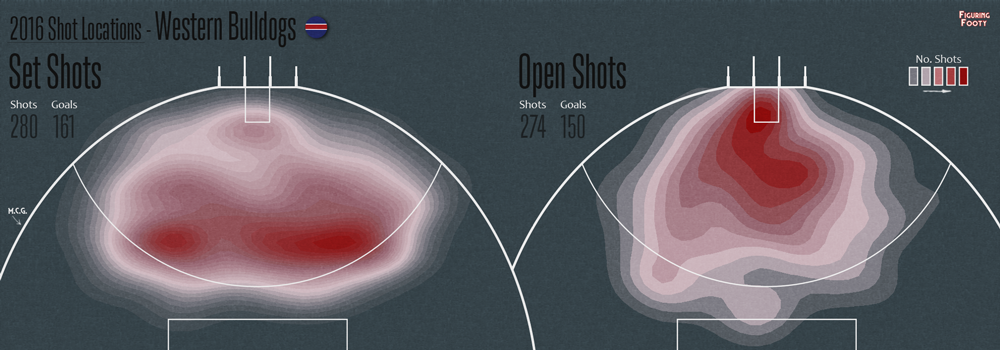
I haven’t really got a lot to say about these. Both sides look pretty similar in regard to the quality of shots they take. Obviously Sydney take a lot more. This seems to be mainly driven by more Open Play shots, but they seem to be fairly disciplined in only taking these from high value areas in the corridor in front of goal.
Also note the little Buddy Franklin area to the left of goal that shows up in any plot that I do of Sydney.
Team Ages

Good question. It turns out that, yes these two sides are very young. Regardless of who wins tomorrow, we’ll have our youngest average aged premiers since Collingwood in 2010.
Both teams have an average age of around 24, with the Bulldogs ever so slightly younger and more inexperienced.1 But average age doesn’t quite tell the full story. A team of 24 year olds has the same average age as a team with eleven 18 year olds and eleven 30 year olds. It makes more sense to look at the age profile of each team.
Luckily for you Bob, I’ve done a bit of work with this stuff before. Radial age plots show the age of every player tomorrow afternoon:
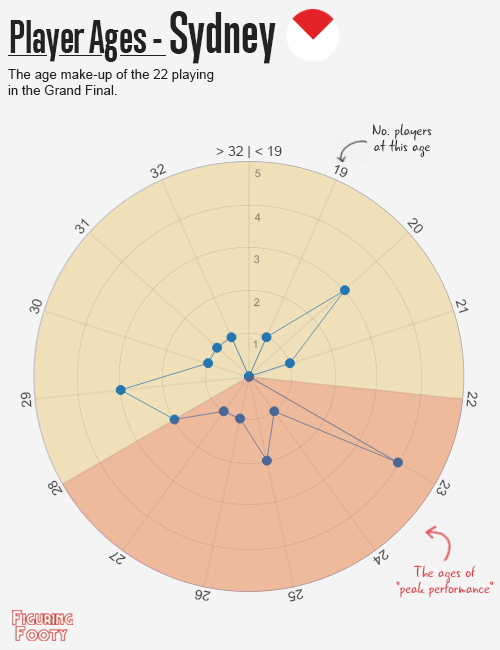
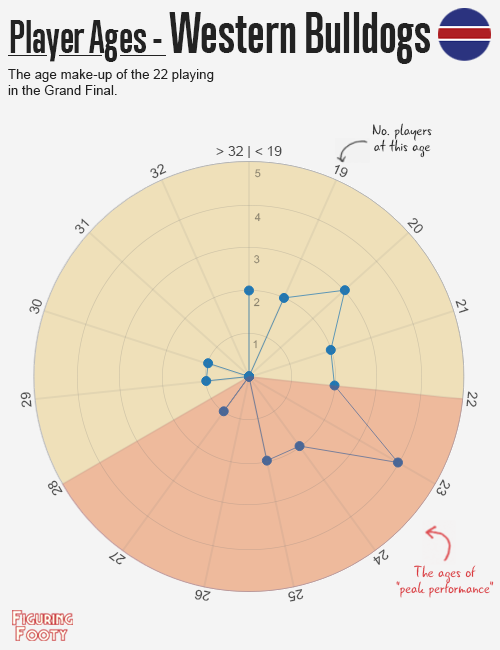
These can be a bit tricky to read sometimes but are worth the effort when the “click”. They show that Sydney have a very even age distribution between 19 and 32. The Swans have a bunch of players aged 23 just coming into their peak (Parker, Mitchell, Lloyd and Richards), a few towards the end of their careers at 29 who will typically start to wind up in the next few years (Franklin, Tippet, Jack) and a few at the other end of the spectrum at 20 (Heeney, Hewett, Papley). Outside of that they have one or two players chipping in at every age (other than 22). They have been very even recruiters.
The Bulldogs on the other hand are a juggernaut of players between the ages of 19 and 25 with a few older faces sprinkled in and a couple of much older guys throwing out the average (Morris 33 and Boyd 34). You can see this “wheel” turning over the next couple of years until most of their side is in that “peak” zone. I daresay this isn’t the last time we see the Dogs in a big final.
Another way of looking at age distributions is by weighting the performance contribution to the team at particular ages:

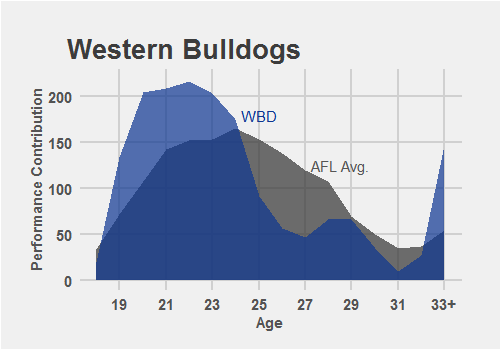
There are still a fair few kinks to iron out with these graphics, but for now all you really need to note is that Sydney have a pretty typically aged squad with a few good young players, but a reliance on the older (29) ones too. The Dogs on the other hand really do have their best years ahead of them.
So that brings an end to my Grand Final previews. One final question: Who do I think will win? Well, the FFSS model predicts a pretty tight one, with Sydney winning about 59% of the time. I probably lean a little heavier towards the Swans, possibly around the 65% confidence mark if you forced me to put a number on it. This is mainly due to the structural advantage I see them having.
That shouldn’t dishearten Dogs fans though. 65% means I still think you’ll get up about one in three times on the day. Regardless of the outcome, I it should be a great game and hard fought battle between two very good teams. What more could you want for the last game of the year?
Follow me on Twitter @figuringfooty to see all my post-match ShotPlots and analysis.